Your gateway to Azure – Log Analytics

There are a ton of articles that detail how to get all sorts of data into Log Analytics. My friend Cameron Fuller has demonstrated several ways to do it, for example. Heck, I even wrote a post or two.

Recently it occurred to me that I hadn’t read a lot of articles on WHY you want your data in Log Analytics. For people that already have data being ingested it’s obvious, but if you haven’t started down that road yet you might be wondering what all the hype is about. This article is for you.

I will tell you right now – Log Analytics is the ‘gateway drug’ of Azure. One hit, and you are hooked. Once you get your data into Log Analytics the possible uses skyrocket. Let’s break down some of the obvious ones first.

Analysis

This one is the get’s the “Duh” award. Get the data into Log Analytics immediately let’s you use the Azure Data Explorer Query Language (aka at one time as Kusto).

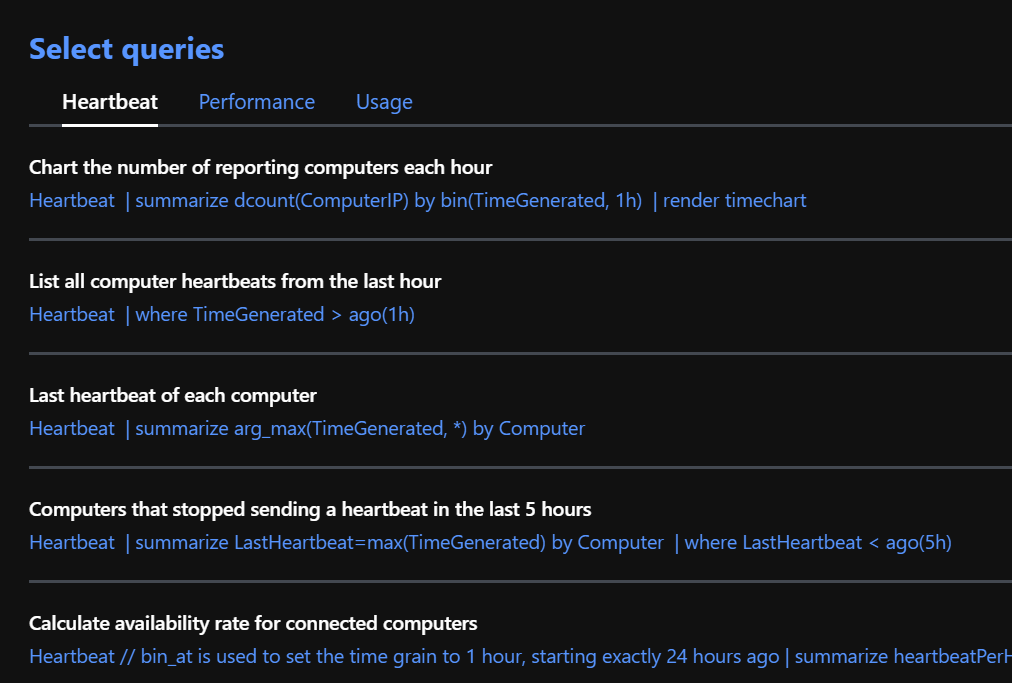
The language is easy to understand, easy to write, and there are tons of examples for doing everything from simple queries to complex monsters with charts, predictions, and cross resource log searches. This is the first, and the most obvious benefit of data ingestion. Not to diminish the capability offered by stopping here, but if this is the extent of the usage of your data then you are missing out.
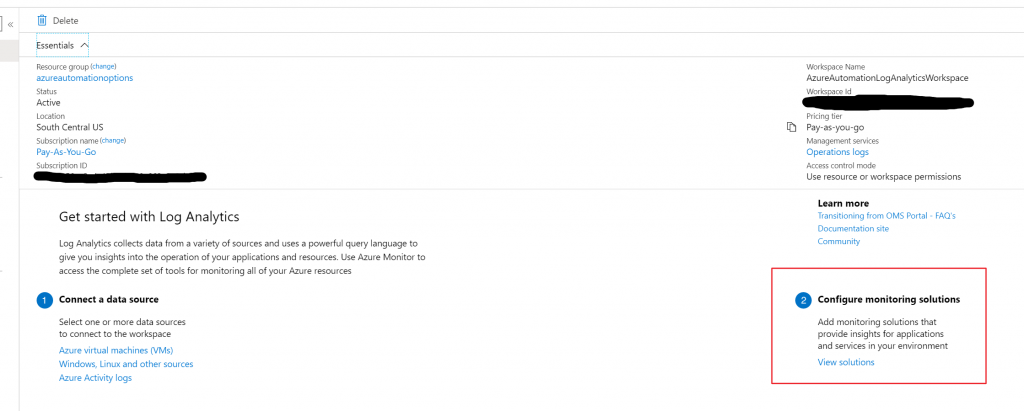
Solutions

Built right into Log Analytics is set of amazing pre-built solutions that can automatically take your logs and turn it into consumable and actionable data points. Need to know how your Operations Manager environment is doing? Connect SCOM to Log Analytics and you are just a few clicks away from seeing performance improvement suggestions, availability recommendations, and even spot upgrade issues before they occur. The SQL Assessment supplies even more actionable data across your entire connected SQL environment. Most of the solutions come with exquisitely details recommendations. Check out this example from my personal SQL Assessment.

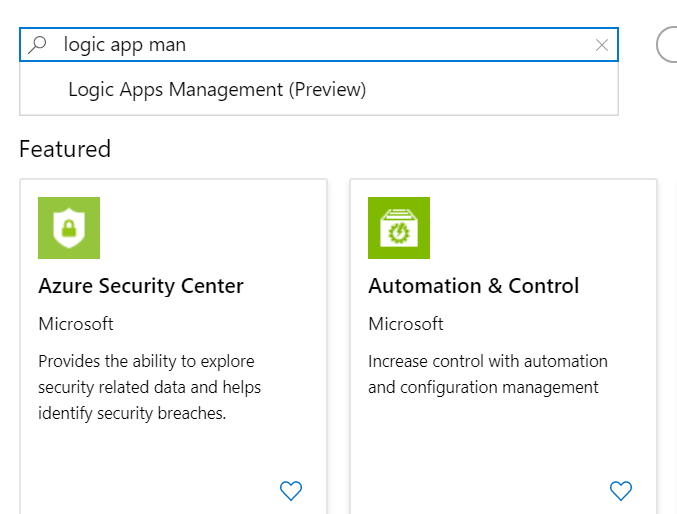
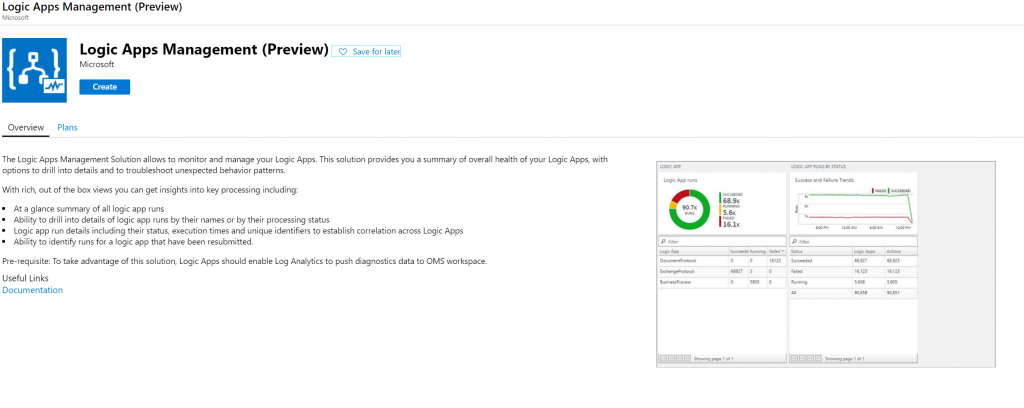
There are many different solutions, and they are being added all the time. Container analysis, upgrade assessment, change tracking, malware checking, AD replication status – the list of solutions is amazing! Even better, the product team that builds these solutions wants to know what you want to see! Go here to see the full list of solutions currently available, and check out the link at the bottom of the page to leave your suggestions.

The not so obvious, and the most fun!

Ok – we’ve knocked out the most obvious usages, but now let’s look at some of the other fun uses!

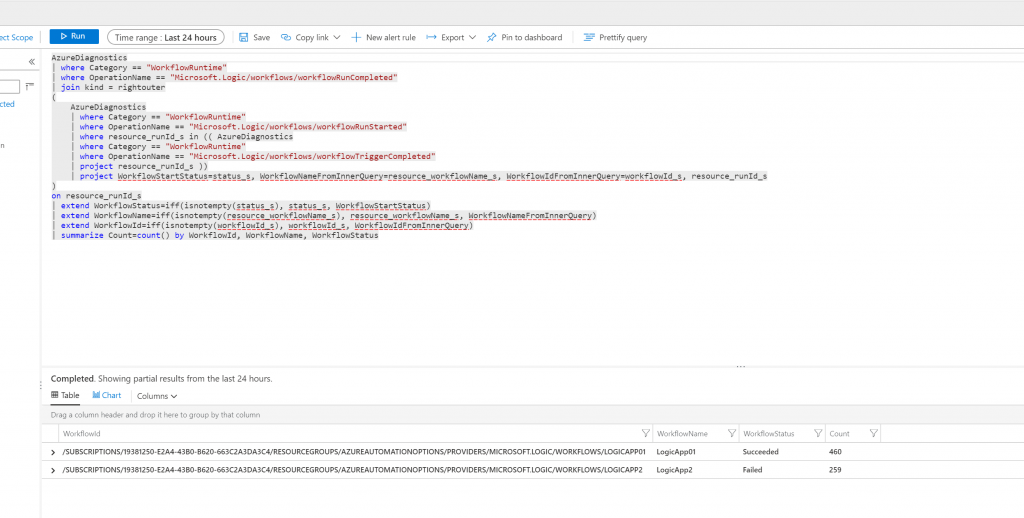
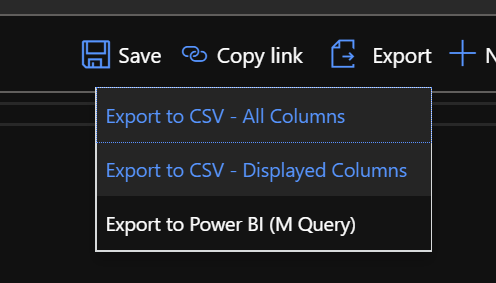
Log Analytics queries can be directly exported and imported into PowerBI! Simply craft your query, click export (see below) and LA will automatically craft the connection information and query for in a way that PowerBI can understand! All of that data suddenly available to the power of one best BI engines in the business.

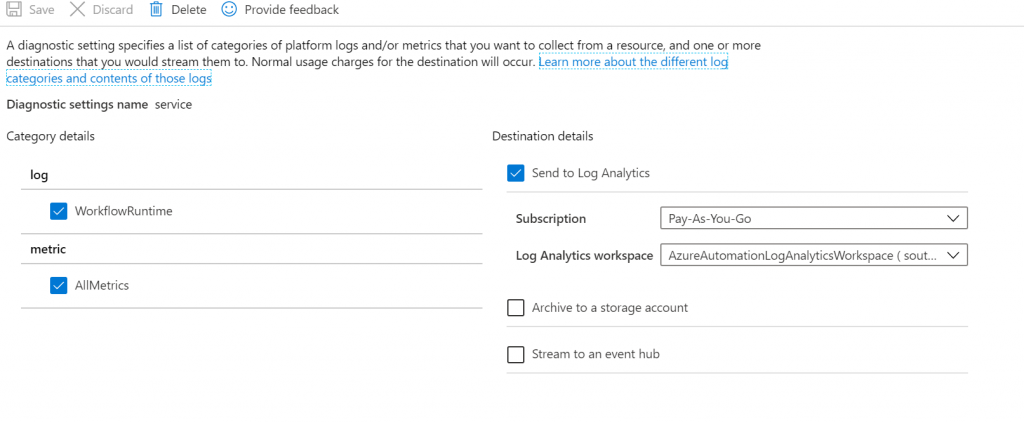
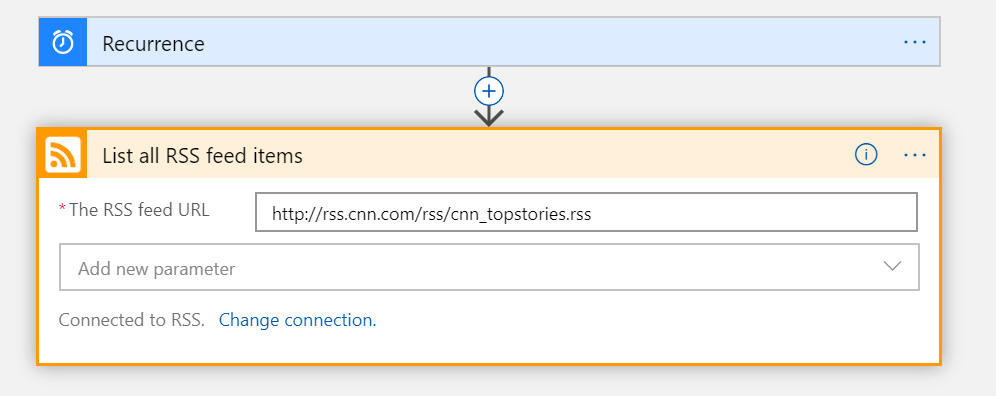
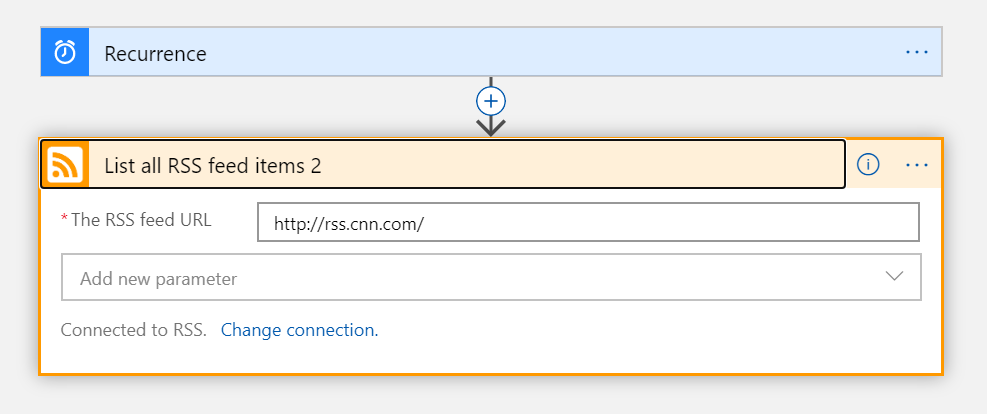
Ok – I can hear you all now. PowerBI is just another reporting type application (it’s not, btw), but what else can we do? How about integration to one of the most powerful set of automation tool-sets in the market? Connectors are available directly in both Flow and Logic Apps that allow you to query your data and trigger from the returned data. This is where your data integration truly starts!

Imagine some of the possibilities for both your on-prem and cloud resources:

  • Get texts about critical updates as they are found
  • Schedule update installations with a full approval chain
  • Send notifications about changes that occur in your environment, sending the notifications to the appropriate teams based on the change type
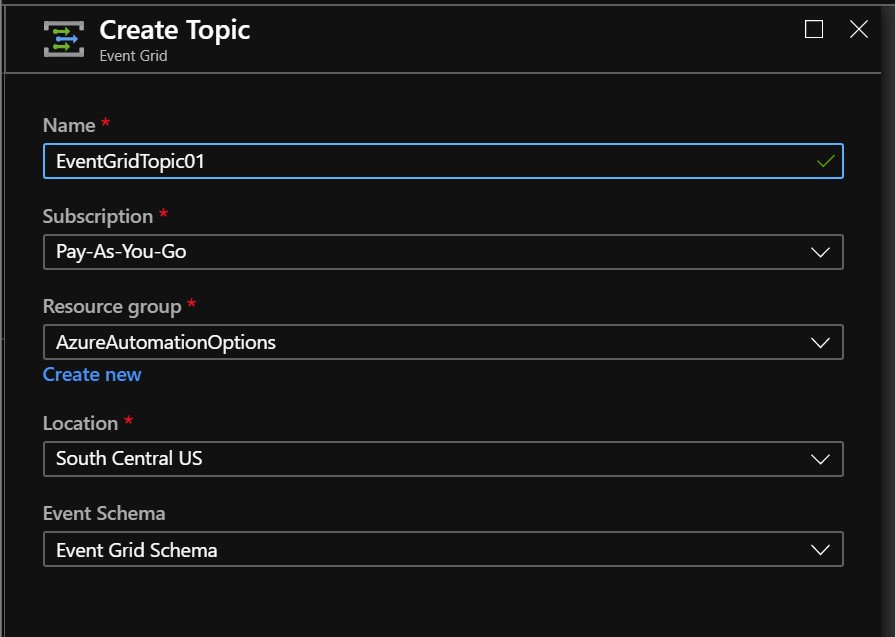
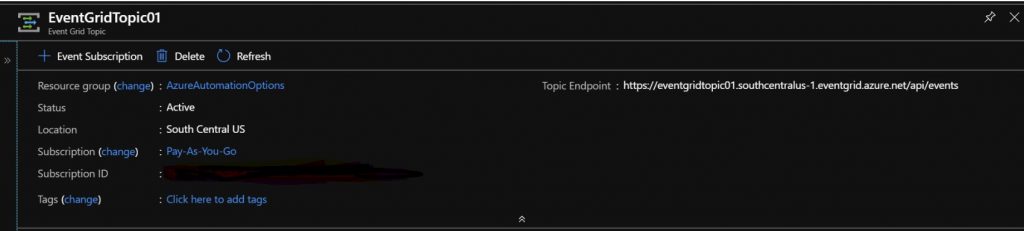
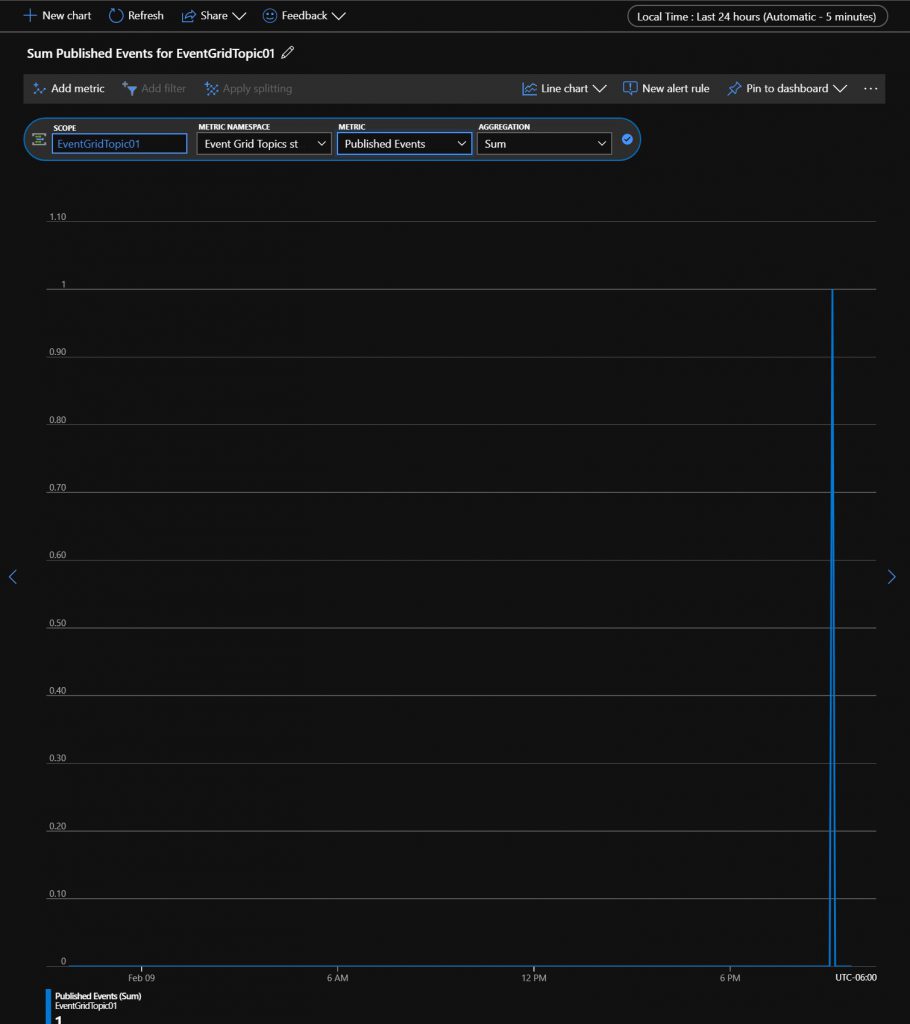
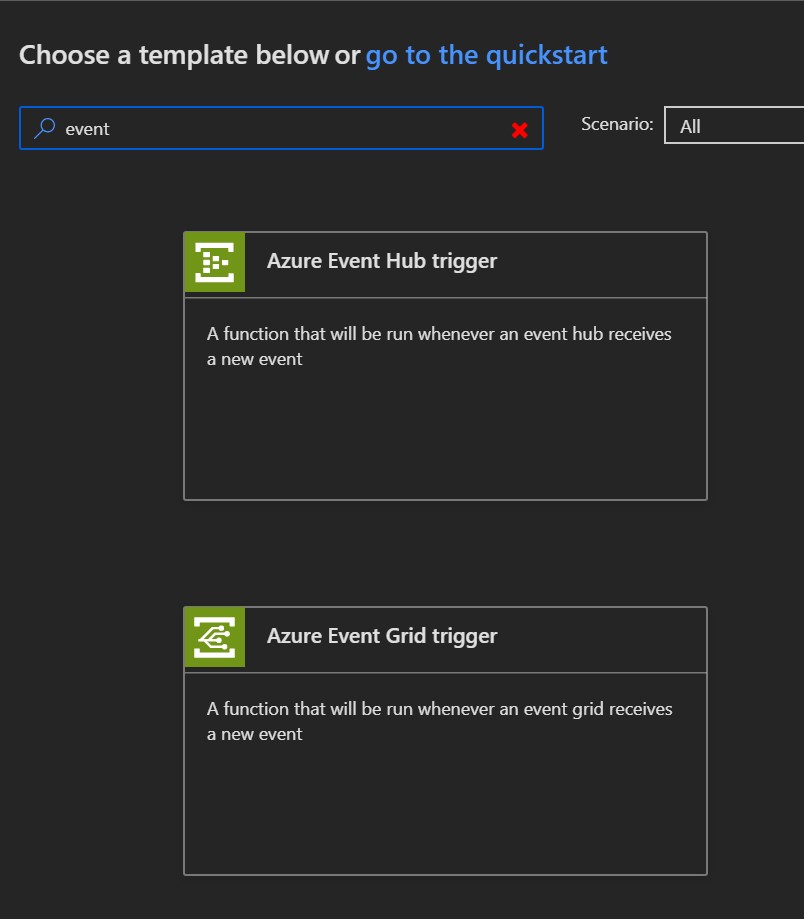
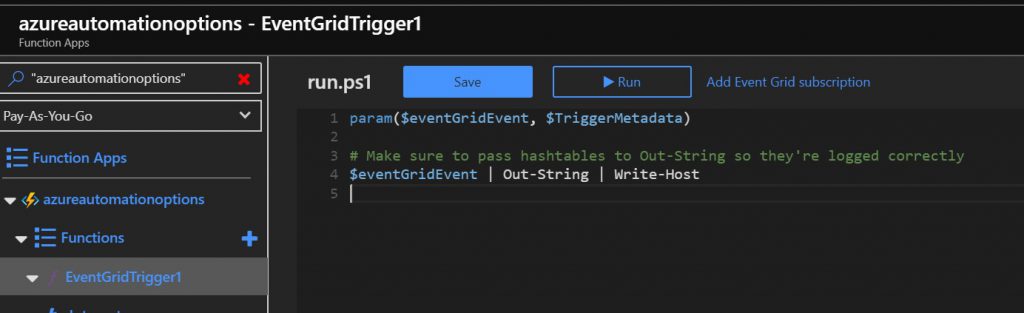
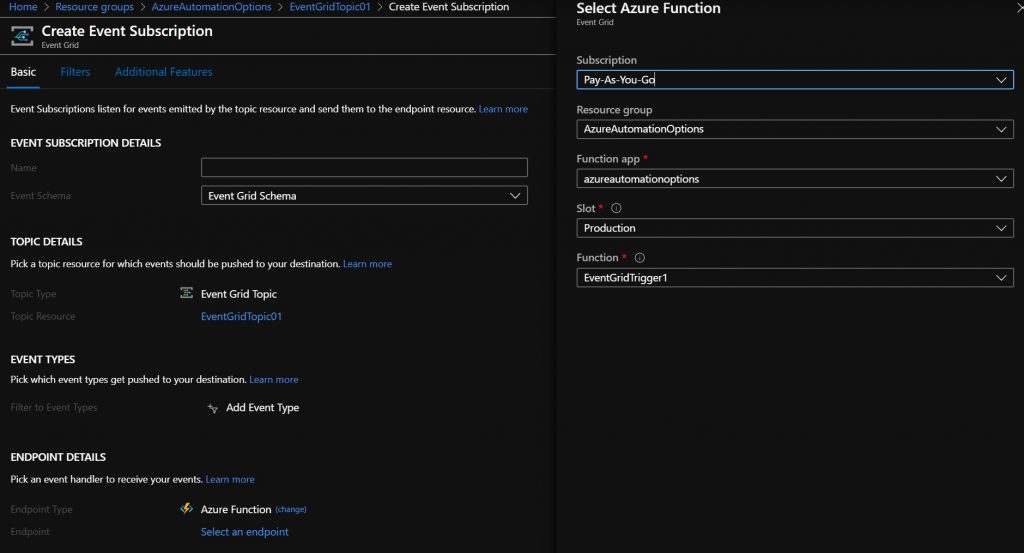
  • Azure Monitor alerts sent straight to Event Grids or Event Hubs for further processing
  • Connect your SCOM alerts through LA and right into Azure automation to perform runbooks in the cloud or on-prem
  • Consume logs from your building entry system and schedule software distributions when people leave the office

Monitor your Logic Apps with Log Analytics (Preview)

This is a continuation of the blog series that fellow MVP Billy York and I are putting on around the journey from on-prem SCORCH to Automation in Azure. In this post we will look at a new preview Log Analytics solution that will help you monitor and respond to issues that will invariably happen with Logic Apps.

Logic App Management allows heavy users of Logic Apps to get both ‘at-a-glance’ updates on the success or failure of their apps, or drill down deeply into app runs and get details such as start/stop time, execution duration, action durations, etc… It is especially useful when you have a very large set of Logic Apps. Trying to get a single pane of glass when you have dozens or hundreds of Logic Apps is difficult with this exciting preview feature.

To add this solution to Log Analytics, you will need…..wait for it…..a Log Analytics workspace! Your existing Log Analytics workspace will do just fine – no need to create a new one. In fact, there are a lot of reasons why you wouldn’t want to! Once you have an eligible workspace, it’s time to add the solution. You can get to this either by adding a resource to the resource group, or adding the solution directly from the workspace – both will start same wizard

One option to add the solution is to do it directly from your Log Analytics workspace.
Searching for the solution…
The actual solution is still in preview, but is very stable.

The actual wizard is very simple – just pick your workspace and click create. Once you have your solution provisioned, you can turn it on or off per Logic App by selecting the “Diagnostic Settings” on the LA and editing the setting below – if you want to turn it off, just uncheck the “Send to Log Analytics” setting.

For this article, I setup a couple of simple Logic Apps – both of them query RSS feeds, but one has a good feed URL, and the other doesn’t. I varied their start times a bit just to show some contrasting data.

The good logic app…..
And the bad one – this URL doesn’t actually work.

I let these apps run for a couple of days. When I look at my Log Analytics workspace, I am greeted with this new tile, and can drill down into to get a nice Logic App run overview:

New tile!
And some awesome graphs!!!

This is a great overview screen for your apps. Notice that the central graph is slightly off – I have tried it in multiple browsers on multiple themes, but it shows the same in each. Hence the ‘preview’ moniker on the solution, I guess. Regardless, at a simple glance I can see the LAs that have succeeded or failed, get a list of the errors, and see a visual comparison of the status of my apps. Clicking on the ‘runs’ tab brings me to a bit more details, and if I click on the “See All” link in the bottom left of each tile, I get a familiar looking interface 🙂

A bit more detail……
Our old friend – Kusto!

For anyone wanting to know the actual query, here it is:

AzureDiagnostics
| where Category == "WorkflowRuntime"
| where OperationName == "Microsoft.Logic/workflows/workflowRunCompleted"
| join kind = rightouter
(
    AzureDiagnostics
    | where Category == "WorkflowRuntime"
    | where OperationName == "Microsoft.Logic/workflows/workflowRunStarted"
    | where resource_runId_s in (( AzureDiagnostics
    | where Category == "WorkflowRuntime"
    | where OperationName == "Microsoft.Logic/workflows/workflowTriggerCompleted"
    | project resource_runId_s ))
    | project WorkflowStartStatus=status_s, WorkflowNameFromInnerQuery=resource_workflowName_s, WorkflowIdFromInnerQuery=workflowId_s, resource_runId_s
)
on resource_runId_s
| extend WorkflowStatus=iff(isnotempty(status_s), status_s, WorkflowStartStatus)
| extend WorkflowName=iff(isnotempty(resource_workflowName_s), resource_workflowName_s, WorkflowNameFromInnerQuery)
| extend WorkflowId=iff(isnotempty(workflowId_s), workflowId_s, WorkflowIdFromInnerQuery)
| summarize Count=count() by WorkflowId, WorkflowName, WorkflowStatus

The benefits of having this data in the “Gateway Drug” (trademark pending) of Azure – Log Analytics – should be obvious. Want to export your Logic App data to PowerBI, or even better setup alerts when a LA fails? Combine your LA data with feeds from AAD, Graph, Office365, etc…. Having all of this data in an easily queried repository is priceless.

Automation with Azure Event Grid

This is another post in a series of posts by fellow MVP Billy York and myself on migration from on-prem automation to Azure. Check out his post here to see the full list.

One of the challenges that needs to be addressed with moving off an on-prem tool such as Orchestrator is how to trigger your automations. Almost all of the tools individually have a method to call them remotely – things such as webhooks, watchers, api endpoints, etc… In this post I would like to highlight how another Azure tool – Azure Event Grid – can prove a useful tool for correlation and centralization. If you need a quick refresher on Event Grids – check out this post. I’m not going to dig into the concepts of Event Grid, but I will walk through how to do a quick setup of Event Grid and get it ready to trigger your workflows.

The first thing we are going to do is create an Event Grid Topic – go to the appropriate resource group, and create a new resource – pick Event Grid Topic, and click ‘Create’.

Specify the event topic name, subscription, resource group, location, etc… The deployment will take a minute or two.

When it’s created, you should see something like this. Take note of the “+ Event Subscription” and the Topic Endpoint.

The topic endpoint is important – this is where you can forward events to from your on-prem resources in order to for event grid to pick them up. This URL takes a json payload (under 64kb in the general release version, with 64kb increments being charged separately – 1mb version in public preview now). Because I am who I am, I wrote a quick PowerShell script that could be used by your resources as a quick and dirty integration.

Connect-AzAccount -Credential (get-credential)
$body = @{
    id= 123743
    eventType="recordInserted"
    subject="App01/Database/TLogFull"
    eventTime= (get-date).ToUniversalTime()
    data= @{
        database="master"
        version="2019"
        percent="93.5"
    }
    dataVersion="1.0"
}
$body = "["+(ConvertTo-Json $body)+"]"

$topicname="EventGridTopic01"
try{
    $endpoint = (Get-AzEventGridTopic -ResourceGroupName AzureAutomationOptions -Name $topicname).Endpoint
    $keys = Get-AzEventGridTopicKey -ResourceGroupName AzureAutomationOptions -Name $topicname
    Invoke-WebRequest -Uri $endpoint -Method POST -Body $body -Headers @{"aeg-sas-key" = $keys.Key1}
}
catch{
    write-output $_
}

The important bits:

  • Subject – What the event subject would be, which is what we will key off of later for subscriptions – this is a personal preference. You can trigger from the event type in the basic editor, but I prefer subject.
  • eventTime – Required, in UTC
  • id – Important, but only if you want unique event identifiers.
  • data – The important bits from your on-prem resources – the bits we will want to pass to the Azure Automation resources.

After sending a couple of events, you can look at the ‘Published Events’ metric to ensure they are coming in as expected:

Now it’s time to give the event grid something to do when the events arrive. There are several ways to accomplish this – all done with a ‘subscription’ to the events. Some of the ‘automation’ flavored options include:

  • Azure Functions
  • WebHooks
  • Sending to Event Hubs
  • Service Bus Queues and Topics

WebHooks are pretty self-explanatory, but also one of the most powerful. For example, you can create a Logic App that is triggered by an http request, and from there break out and perform any type of automation that you want. I will go over that in another post. For this post, I will show a slightly more difficult to setup, but equally as powerful method to start automation – the Azure Function EventGrid triggered function. Head over to your Azure Function, and let’s add a new function:

Select the “Azure Event Grid trigger” and give it a name – in my case I gave it the descriptive name ” EventGridTrigger1″. After it’s created, you should see something like this:

You can see the parameters – eventGridEvent and TriggerMetadata. Keep those in mind. Now head back over to the Event Grid Topic, and let’s add a new subscription. When you select the endpoint in the new subscription, you should see your EventGridTrigger function:

Great – since the function is created already, the endpoint is something we can select. If the function wasn’t created, there would be no option to create a new one.

Now we can dig into the actual subscription properties – notice the 3 tabs. Basic, Filters, and Advanced Features. Filters is where we will do most filtering for automation, although some can be done in the basic tab via the event type. For now, just set the Event Type to ‘recordInserted ‘, since that is what we put in the PowerShell code, so we can switch over to the filters and do the rest of the work.

On the Filters tab, the first thing we want to do in this example is check the box marked “Enable subject filtering”. If you remember in the PowerShell, we set the filter to “App01/Database/TLogFull”. You could imagine this being the unique identifier to trigger the appropriate automation – almost something like a unique monitor ID or an automation trigger id. In this example, let’s set that as our filter. We will do this simple one in this post, but branch out and look at advanced features in a future one:

When you are ready to create your new subscription, head back to the ‘Basic’ tab and give it a name – numbers, letters, and dashes only. Do it right, and you will be greeted with something like this:

Now that we have the subscription created, let’s send some events and see if they trigger the subscription! If you run that PowerShell snippet a couple of times, wait a minute or two, and check out the ‘monitor’ tab of the EventGridTrigger function, you will see something like this:

And clicking on the details:


From here, we can see the data fields that were passed, and which could be used in our PowerShell function.

Hopefully you can see how using an Event Grid can help trigger your automations, especially when dealing with IOT and monitoring situations, or when a simple webhook is all you have to work with. They offer an easy way to take those PowerShell workflows from Orchestrator and directly import them into Azure with little modification, while at the same time providing a centralized method of tracking.